Posts

Demystifying Track Terminology

Lisa Stewart caught up with Alisdair McCrudden of 12d WA for a chat about the terminology surrounding 12d Track, our rail module (available free to customers on Maintenance who have purchased both the Detailed Alignment Design module and the Volumetrics and TIN Analysis module). Alisdair’s aim was to ‘demystify’ this terminology, and indeed some of the processes involved in rail design, which he maintains is not too different from road design. Alisdair says a competent road designer will easily switch to rail design with the guidance of a rail engineer or experienced rail designer.

Alisdair took us through some of the commonly used terms encountered in 12d Track (and rail design in general), including:

  • Rail
  • Sleeper
  • Ballast
  • Capping
  • Formation
  • Gauge
  • Cant
  • Pandrol Plate
  • Cross over
  • Turn-out
  • Curve Compensation

Alisdair also took us through an example of a Snippet being used to produce a decisional cut and fill template, including what can go wrong and how to fix it.

Watch Alisdair’s full presentation here:

The Technical Preview Version of 12d Model 14 is already in use by many of our customers on Maintenance who attended this year’s 12d Technical Forum…stay tuned for details of our 2020 event (2-4 August 2020, back at Brisbane Convention and Exhibition Centre) if you want to get in the loop early for 12d Model 15 as these lucky folks have done this time around!

Click here for training in your region: https://www.12d.com/training/index.html

Point Clouds at Brisbane City Council

Peter Murray spoke to our 2018 Technical Forum delegates about Brisbane City Council (BCC)’s use of Point Clouds in 12d Model software.

Peter works in the Surveying area of BCC, which is actually run as one large local authority covering the whole city; it’s unusual in that sense. It’s the largest local authority in Australia, by both budget and population (it covers a population of around 1.2 million and an area of 1,367 square kilometres). It works to an annual budget of around $3.1 billion – to cover traffic management and infrastructure, public transport, parks and opens spaces, economic development, and lifestyle and leisure. This leads to a great deal of variety in work – large projects and many smaller ones as well.

There are nearly 8,000 people working in the organisation. In Planning and Design, there are nearly 350 people – surveyors, road designers, drainage designers, bikeway designers, Geotech, pavement designers, landfill management, GIS, architects, landscape architects, water management, flood modellers, urban planners, and environmentalists.

What is a point cloud?

A point cloud is just a huge collection (thousands-billions) of points – they’re unrelated despite looking like they’re related. The enormous scale causes issues – bigger projects lead to more things that can go wrong. Point clouds have been in use since the mid-1990s…which gives some pause as to whether they’re still as relevant as they’re sometimes deemed to be.

How do we acquire point clouds?

A point cloud can be generated by laser scanning (e.g. Terrestrial, Mobile, Aerial), via photogrammetric techniques (e.g. UAVs), or using SONAR (e.g. Hydrographic Surveys).

Why do we use point clouds?

They appear to be very detailed and intuitive – they look almost like photographs (and it’s possible to measure between the points), which makes people think they’re loaded with useful information. Point clouds can also be captured rapidly and at a relatively low cost (particularly using LiDAR – this can lead to being able to capture, within days, huge amounts of information that would otherwise take surveyors years to collect). They allow for measuring of areas with difficult access, allowing for increased safety in areas such as freeways and dangerous industrial areas (e.g. through use of drones). And they’re intimately intertwined with BIM, which makes them unavoidable, especially as they become more and more mainstream and accessible to a wider audience.

What are the potential downfalls of using point clouds?

Highly specialised skills are required to produce a high-quality point cloud. The size of the datasets required is also prohibitive. It is also an issue that point clouds don’t fit well with traditional design processes, and are technology hungry – a variety of sophisticated equipment is required for their successful use.

How do we collect the datasets for point clouds?

  • LiDAR – used since about 2010 by BCC for flood plain modelling, concept designs, investigations, and volumetric resumptions, LiDAR is regularly incorporated into their workflows and is an accepted data source. Data is generated by a plane flying over the ground with lasers pointing below and measuring downwards. As the lasers hit the ground, the beams are reflected back up to the plane so the plane can take measurements, at a rate of about 2 million measurements per second! Unfortunately, vegetation and water are the ‘natural enemies’ of LiDAR, so it can’t be used everywhere. Over time, their teams have learnt that not every point is required, nor is every point reliable…and unfortunately it isn’t always possible to pick the reliable points by inspection.
  • LAS files (which have evolved from LiDAR) with categories, which are generated when reflections bounce off g. leaves and trees, leading to greater ability to filter out extraneous information, determine roof heights, interpolate floor levels, etc. LAS files are very useful in particular circumstances, and are included (with accompanying macros) in a number of BCC workflows.
  • The new ‘Point Cloud Surface Thinning’ option in 12d Model 14 – a very neat function allowing draping of strings through point clouds. This means points can be concentrated where changes in grade occur, leading to a reduction in ALS points. The result is better-looking contours which are closer to the original…at 12% of the size of the original dataset.
  • UAV LiDAR using drones – this can be great for working in what would otherwise be very dangerous areas.
  • Mobile Laser Scanning – this is more accurate and less expensive than LiDAR, but also more difficult to control.
  • UAV Photogrammetric Point Clouds – this method is quick and inexpensive, but again there are issues with control.
  • Terrestrial Laser Scanning – BCC had experience with this years ago, for bridge scans. Using this method, small amounts of important information can safely be obtained.

What they have learnt at BCC

Overall, point clouds are an efficient and practical way of collecting a dataset. It is important to remember that not all the points are needed, and that not all clouds are the same. Also, file extensions are not a reliable indicator of contents – there are standards in existence, but they are not always followed. Peter also cautioned against such marketing claims as ‘Scan to BIM capability’ as they are not always what they seem.

Some of the point cloud outputs include a full point cloud (which is a good record of what was there), extracted objects, vectors and points, surfaces (TINs), and viewers. These can be used in such areas as geospatial, forensics, and film.

Point cloud functionality in 12d Model

Peter said there is definitely value in point clouds, but they’re not yet civil design ready, at least not universally. 12d Model manages point clouds well, though – it will read them in with ease.

12d Model will import common formats of point cloud, convert between formats, and perform projection transformations. It uses a ‘String_cloud’ element. In 12d Model 14, these processes have been improved even further – there is now capability to import multiple files, selected in Perspective view (which has also been made more responsive and reliable). Threaded views have also been added.

Peter also outlined some of his favourite point cloud functionality in 12d Model – including manipulating categories, deleting/undeleting, draping against point clouds, drawing flags, limiting clouds, pinning clouds, and of course the aforementioned Point Cloud Thinning.

Where to now for BCC and point clouds?

As they’ve now reached such a level of success with LiDAR point clouds, they’re now looking at scanning drainage chambers, scanning buildings, and data extraction and modelling (including vectors, trimeshes, and pipes). Peter showed examples of terrestrial laser scanning they’ve done (in particular with manholes). He has been investigating ways to utilise point clouds, including a macro (within 12d Model) to slice them, meaning he could extract a trimesh out of a point cloud to reduce it to a manageable number of points. By colouring the trimesh, surrounding spots have been made visible, and the clouds have become more valuable in his day-to-day work. By combining an image and a point cloud on some other projects, further usefulness has been discovered.

BCC has been developing a specification for the extraction of trimeshes from point clouds, as well as mapping files and 12d Field codes. They have utilised DTM auditing routines for trimeshes. Recently they purchased a BLK 360 scanner, and they are working on developing in-house skills to take their use of point clouds even further.

In essence, keeping full point clouds is a good way of maintaining an accurate record for future reference, and with some ingenuity, their day-to-day usefulness can be harnessed on some projects, too.


Watch Peter’s talk here: http://bit.ly/2PcZW2x

Complete Design Documentation on the Parramatta Light Rail Project

Niall Brady (Digital Engineering Lead) and Jarred Dickson (Senior Highway Engineer) of Arup Sydney addressed the delegates of our 2018 12d Technical Forum recently about an exciting project they’ve been working on – Stage 1 of the Parramatta Light Rail.

The Client for the project is Transport for NSW. Stage 1 of the Parramatta Light Rail will connect Westmead to Carlingford via the Sydney CBD & Camellia. It will consist of a two-way track spanning roughly 12km, with both on-line (through urban streets) and off-line sections. The track is due to open in 2023.

Parramatta is in the west of Sydney. The areas that were discussed in this presentation are Enabling Works Packages in Sections 1 and 2 – along Church Street and O’Connell Street (moving traffic off Church street onto O’Connell Street to allow for the construction of the light rail), and Section 3 (along George Street – moving traffic off Macquarie Street onto George Street and changing George Street from one lane to two in each direction). This will also involve a section along Hawkesbury Road – adjacent to the upgrade of Westmead Hospital.

The scheme is currently in the Tender Review Stage. Stage 2 has been announced and is in its early design stages.

Arup needed to be able to deliver all three Enabling Works Packages in 16 weeks – a very quick turnaround – to submit to a contractor to be constructed before the main works commenced. It was necessary for a high level of Digital Engineering to be applied. This led Arup to develop a 3D Federated Model, applying Work Breakdown Structure and Naming to enable 4D BIM Cost, 5D BIM Cost, and 6D BIM Asset Management. They also used a model for Design Coordination and Stakeholder Engagement.

So what is Digital Engineering? According to Arup, it is a “collaborative way of working using digital processes to enable more productive methods of planning, designing, constructing, operating, and maintaining assets. This is achieved by creating a Common Data Environment (CDE) that aligns digital information systems – including CAD, controls (time, cost, risk, etc.), asset data, and other data systems.”

Digital Engineering in 12d Model

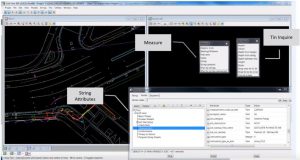
The design tools the Arup road design team used to reduce the amount of rework, documentation, etc., and ideally get design right first go, included:

Smart Snippets

The team tried to limit the number of manual inputs into Snippets that could result in errors, so the Snippets had the code embedded or hard-coded in, or referenced project details, attributes, etc. to create consistency across the project. The theory was that if the design models are consistent, the output models should then be consistent.

In addition to design elements, they drew upon other Snippets – e.g. vertical clearance envelopes, modelling clear zones within 12d (this meant they could design barriers on the fly without needing a review process afterwards). Other disciplines were also using these outputs – e.g. clear zones to landscaping teams so they knew what they could plant where.

Snippets worked in the background to embed attributes into trimeshes, so when they sent IFC models out to other packages, they could interpret the designs straightaway without asking questions – this sped up coordination between disciplines.

Smart Chains

Standardised/transferable chains. One source meant one chain could be run multiple times, taking advantage of parameter files. This meant they could make tweaks to outputs easily and then get consistent outputs across disciplines and packages.

The team also filtered 12d data to geographical regions and attribute data, and used this to connect models across all systems to apply cost and time for construction.

They took that a bit further and, rather than using chains with parameters, they wrote macros (e.g. Automating Road Furniture – Line Marking, Kerbs, Traffic Signs, Scheduling; Design Verification – Aquaplaning; Design Verification – Swept Paths, Sight Lines – for e.g. mapping 3d survey model to actual 3d objects, HGL to Trimesh) – this mean they didn’t need to upskill others on parameter files; the macro provided a user-friendly interface. This saved a lot of time in documentation, training, etc.

All this was done “on the fly” (including conformance checks) so there was less checking at the end.

Utility Coordination

Utilities are critical, especially in an inner-city environment – they can be high-risk on projects such as this. The Arup team worked with transport and other consultants to set up a better process for coordinating utilities.

The UUS Schema, Utility Specification, Surveyed Information, and DBYD (GIS Data) were read into a 12da file (single source of information), which then populated the Navisworks 3d Model, GIS Portal, and 12d Model, which in turn created the Utility Design, Rail Design, Drainage Design, and Road Design.

The Utility Schema was based on the AS 5488 Classification of Subsurface Utility Information (SUI). Additional attributes were added and standardised to simplify GIS setup, 12d Mapping (long sections and cross sections), and Federated Models properties. Every utility had approximately 70 attributes for type, clash, risk, and treatment.

Utility Coordination – 12d Workflow:

  1. Digitise the Dial Before You Dig data in 12d Model
  2. Identify additional utility survey required
  3. Import 12da file from Surveyor
  4. Apply unique ID (GOID) using a macro
  5. Apply attributes using a string filter
  6. Apply remaining attributes from Register
  7. Apply attributes from mapfile
  8. Apply pipe diameter from ‘pipe size’ attribute

All this was automated in a Standardised Chain

  1. The model was then exported to IFC for GIS and Federated Models

The team was pleased to note that when you select a string in 12d Model and view its properties, you can take that forward and see that exact information in the GIS Portal and in Navisworks; this powerful functionality was a great help to them on this project. Their deliverable was a full set of drawings – longitudinal and cross sections, so there was much to be done.

The GIS Web Platform doesn’t require software – users can just click on the utility portal. They were also able to provide access to contractors.

Federated Model – IFC Files

Along Hawkesbury Road, a number of different consultancies, as well as disciplines, were involved. These were brought together in 12d Model. All files were exported as IFC.

Arup delivered this entire detailed design in just 16 weeks. They delivered the 3D BIM model with attributes for 4D, 5D, and 6D, as required. They also delivered a full set of drawings for all disciplines. This was all done with a small full-time team – 3 engineers, 1 designer, 1 CAD person. By using a model in stakeholder engagement and speaking frequently to client RMS they reached ‘Agreement’ on departures (trees in clear zone/sightlines).

They could not have achieved these results without 12d and adopting Digital Engineering processes.

Fulton Hogan on 12d View

I caught up with Michael (Mick) Connor – Survey Manager at Fulton Hogan – about his team’s use of 12d Model with 12d View (and 12d Synergy). This webinar was based on a presentation Mick delivered at our 12d Technical Forum in July.

Mick has over 19 years’ experience in surveying, so we definitely value his opinions on such matters! Fulton Hogan is a large infrastructure, construction, roadworks, and aggregate supplier company in New Zealand, which is also active in wider Australasia. The company was founded by Julius Fulton and Robert Hogan in Dunedin in 1933 (Source: Wikipedia).

The Sydney B-Line bus project has revolutionised bus travel along the Northern Beaches and Lower North Shore into the northern end of the CBD. Such an ambitious project presented certain challenges, including narrow corridors, especially through Neutral Bay and Cremorne, where roads are congested with utilities.

With the help of 12d Model with the 12d Viewer (12d View), Mick and his team were able to alleviate the strain of such an enormous project detracting from their day-to-day work. When their engineers were able to harness the power of 12d View for their utility analysis, time, cost and quality benefits ensued, meaning the engineers involved in the project were afforded greater ownership and accountability, leading to a greater sense of empowerment. In turn, this allowed Mick to gain back some much-needed time each day, because he no longer needed to oversee other processes as much.

12d View screenshot

Mick said the installation process for adding 12d View was simple. Then once he added it on, he simply ran a Chain to output the models he needed on a weekly basis, and the designers would just read that in using drag-and-drop.

To hear more about how this innovative team uses 12d products, watch the video of our latest Industry Solutions webinar!

Fulton Hogan Website

–Lisa Stewart

12d View for Surveyors

Michael (Mick) Connor – Survey Manager at Fulton Hogan – will chat with me on 31st October at 1pm about his team’s use of 12d Model with 12d View (and 12d Synergy). This webinar will be based on a presentation Mick delivered at our 12d Technical Forum in July.

He’ll take us through their journey, and what they encountered on a recent important project – Sydney’s B-Line, which has revolutionised bus travel along the Northern Beaches and Lower North Shore into the northern end of the CBD.

Some of the challenges they encountered on this project included narrow corridors, especially through Neutral Bay and Cremorne, where roads are congested with utilities.

The Fulton Hogan team worked through the night most nights to minimise disruption to users of the existing network until the new one could be launched.

Mick found that the enormous project was detracting from his day-to-day work, and he needed to find a better way to do things. Enter 12d Viewer.

Using this innovation in 12d Model, Mick’s team saw time, cost, and quality benefits, leading to greater empowerment for the engineers involved in the project – it allowed them ownership and accountability, and in turn this allowed Mick to achieve more with his days because he no longer needed to oversee other processes as much.

To hear more about how this was achieved, register to attend our free Industry Solutions Webinar at 1pm (Sydney time) on Wednesday, 31st October, 2018.

–Lisa Stewart

Civil Object Creation in 12d Model

Steve Hunter of AECOM spoke to our 2018 Technical Forum delegates in July about civil object creation in 12d Model software.

Steve said that at the time of the 2016 12d event, most of the designers he was working with had come to grips with workflows and mechanisms to expand their modelling of civil infrastructure with the solid modelling realms of trimesh pavements, plus linear elements such as kerbs and barrier systems. He said they were already reasonably proficient at reading in structural models, and two years later the focus on the digital engineering modelling effort has grown even more intense, with seemingly endless demands to expand the content and depth of 3D models. All this extra output has needed to come without taking its toll on the design effort put in to the generation of end products. The critical word in that last sentence is ‘design’, and it goes a long way to explain the major difference between the process that goes into developing a traditional Building Information Model (BIM) and a modern Digital Civil Engineering Model. Even the difference between the terms ‘Structural Drafter’ and ‘Civil Designer’ gives additional clues as to this difference.

Virtually all the workflows and driving forces behind generating a structural BIM revolve around progressively bolting on more and more detail as the design evolves, with nearly all the detailed embellishments being edited in a virtually static framework. In a civil or linear engineering design – the ‘BIM PowerPoint’ – there is never any guarantee that even the most detailed object is in the final location, or that the number of objects won’t change as designs are optimised to give clients the most cost-effective, safe and practical design; invariably through a process of intensive duration that can even continue into detailed design at times.

In Steve’s opinion, a single majestic pass for a civil engineering design progressively adding on more and more detail to the original concept is likely to lead to delivering a detailed but non-optimised solution. A civil engineering design is a dynamic process, and every detail added to models must be flexible and self-healing, adapting to the many ongoing design changes brought about by the optimisation process to prevent modelling errors. Designers should not allow themselves to be ‘painted into a corner’, unwilling to make major improvements or updates to alignments and designs because it’s just too hard to make any manual changes that result.

To Steve, the term ‘BIM’ has come to represent the effort to shoehorn into a civil engineering model a system designed around a building or structural framework. A classic example of this is the mindset of pretending a road is just a really, really tall building with cars driving on it, and that the floors are regularly shaped segments along the road. Of course, roads are notoriously uncooperative and have awkward stuff in them like interchanges, which pushes the building analogy to its limit!

Steve felt it was important at this juncture to highlight the main purposes of a federated linear engineering model. By far the most important is that of space-proofing – eradicating clashes between objects created by the various design teams that contribute to the final design; this has always been the cause of many last-minute frantic design changes out on site when most of these clashes were finally discovered.

Of course, to run this space-proofing or clash detection process, which is not always a formal reporting process as it also includes the simple but always effective ‘eyeballing’ process, you need to have all these objects created to the level of detail appropriate to their use in the digital engineering model. This leads to the debate about what constitutes an appropriate level of detail for a particular object. For instance, when modelling the top of an access chamber, does adding the surface textures really add to the value of the space-proofing process? As you continue to work your way through the list of details that don’t contribute to the space-proofing function of this object, you eventually get something that takes up the rim of the riser and the lid, and which is located where the access point will be relative to the part configuration as this may impact on surface features.

One of the other important uses of civil objects is as placeholders for additional information or metadata about the object, meaning that unnecessary detail does not need to be crammed into civil objects, particularly when most of these are actually standard objects, and this additional information can be provided by simply referencing the documents containing this additional detail. An example of unnecessary detail is including something like a physical grate in a model of civil objects. This level of detail bloats model data size with little real benefit to the primary reasons for modelling these objects in the first place. A solid object taking up the space occupied by the grate with metadata attached to it has exactly the same value without the data footprint.

Humans are primarily visual creatures, Steve maintains, and we are programmed to think that the level of pleasing, superficial visual detail is directly comparable to something’s true value in this world. In the 12d world, a classic example you often see of this is something simple like non-textured vs textured TINs – it looks pretty and visually appealing, but the true value of the 3D model in a perspective view is shown in a simpler but correspondingly more valuable non-rendered way when design abnormalities are visible and can be identified and rectified.

The 3D models produced by Steve’s team are engineering models, not visualisation models, and this is particularly the case when trying to inject realism into models to make them theoretically better, while actually reducing their true engineering value. There’s an ongoing debate about how to model hybrid linear objects such as guardrails where they can use the realistic looking 12d Model extruders to show the posts and rail for guardrails, and even use these extrudes for sight distance checks.

AECOM’s guardrail snippet produces a trimesh region representing the space above ground for sight distance checking, and another below ground that the guardrail installation will occupy for clash detection. Their civil designers keep challenging the engineering value of modelling individual posts, and repeatedly point out that it can actually be misleading to apply interval-based posts based on the extents of the strings designed to represent the guardrail. Even if end treatments are excluded and simply paced out in two-metre steps from the start of the guardrail string, this process starts to unravel where the guardrail passes from one MTF function to another, resulting in a new string and a reset in the post placing. This means that the posts are potentially in the wrong location and false positives could result when running clash detection reports. False negatives that flag further investigation are vastly more acceptable than false positives, which can mask potential problems.

Humans often have the tendency to jump to the conclusion that something which looks more detailed is automatically more accurate. There are examples of fence posts being shown in great detail but in purely interval-based locations; they’re not representative of where they’ll actually be built. Treating fences and noise walls with the same logic as guardrails, the AECOM team runs a custom extrude along a super string representing the fence location, generating a model of the zone where the fence post may be, and addressing the potential clashes more closely when they are identified. Their current challenge in how they model isolated civil objects in a practical manner is doing so in a fashion which does not require a ‘doctorate in macro programming’, therefore limiting it to a select few. The process also needs to be immune to inevitable design changes as the engineering model is optimised and amended throughout its design life cycle. Civil objects they need to include in their digital engineering model originate either inside or outside 12d. Inside 12d they have 3D features such as electrical objects and survey models; outside 12d they often have 2D features (generated by specialists in other packages) – e.g. signs and line marking or street lighting and traffic signal layouts. It can be pretty alarming that objects which appear insignificant on a 2D drawing actually occupy a large amount of 3D space through which they’re trying to thread proposed utilities.

The civil object workflow is not limited to existing and proposed utilities, and can be used for other civil objects such as a very large chunk of concrete that may be needed for anchoring wire rope safety barrier systems. Bearing in mind that the reason they’re creating these civil objects in the first place is primarily for space-proofing, an allowance needs to be made for such a large block of concrete. What makes this object different from, say, a light post, is firstly that the holding symbol needs to be applied to the end of the model of the wire rope safety barrier string and secondly that the orientation of the holding symbol needs to match that of the string terminal. To achieve this aim, the AECOM team organised to create a custom macro in 12d to achieve this…enter Sam Cech of Tatras Consulting in New Zealand! The resulting wire rope safety barrier snippet produces a result very similar to the guardrail snippet, plus it adds terminal information attributes to the marker string which is then used to place the holding symbol. When the civil object chain is run, the trimesh terminal objects take up space in the federated model for the BIM folk to play with.

Sam’s macro is also used to place civil object holding symbols for other directional objects such as light poles and traffic signals with mast arms. In theory, if the focus is purely on space proofing and clash detection, it is primarily the post and footing that are important; the rest is aesthetics. They do, however, want to make viewing the federated model an intuitive experience to allow for easy visual identification of civil objects, and fortunately setting the orientation to these objects is easy to automate. For the Surveying team at TMR, for instance, the mast arms for traffic signals and light poles are represented by two points running from the lantern to the base of the pole, and by placing a holding symbol at the end of the string and running the civil object chain you get lights that are correctly orientated with a process that’s about the same amount of effort as applying a standard mapping file.

Steve originally thought they’d need a drawing template based civil object chain to run on the drainage PPF plans to evolve their drainage network into what is needed for federated engineering models, but he started investigating the option of drainage trimeshes that are set in the drainage.4d file and – as with the other civil objects shown – it relies on a 3D library of drainage structures to cap off the top of the drainage model chambers, with up to 24 variations needed for each pit style to take into account lintel size, channel width, inflow configuration and orientation relative to the kerb. These have always been defined for hydraulic reasons but now also need to take into account the kerb type to include the kerb transitions in the trimesh (and ultimately in the federated model). The top structure of the gully pits and access chambers orientate themselves in the same way as the drainage plan PPF plots, including automatically adapting to the flow direction so no extra effort is required from the drainage designers because the drainage trimeshes update with a standard set pit details process. Steve was particularly impressed that the drainage trimesh also tilts itself to suit the road grade calculator and the setout string, so the final 3D orientation is actually very close to the real thing.

AECOM’s drainage designers have always modelled the existing drainage network, primarily for hydraulic reasons, but it’s now included in the federated model, and one of the processes designers typically had to do pre-BIM was to separate the drainage model into the kind of categories or states that are referred to in the modelling of utilities, partly because the various states can then be visually identified or even manipulated visually in the federated engineering model. Engineers and ‘BIM folk’ become concerned if they see a drainage structure in the middle of the road on a design,  even if it is one that’s flagged for removal, so it may be necessary to temporarily hide objects such as these. You can currently do this in 12d Model by incorporating and identifying the pit and pipe names and filtering for these in the drainage trimesh model – i.e. splitting them into submodels.

The final plan integration of these model drainage structures into AECOM’s models is adapting the road designs to leave gully pit shaped holes in their design surfaces and other trimeshes. Steve ‘tried to be sneaky’ by including a boundary string in the drainage pit trimesh definition which could then potentially be used with a 12d Model 14 trimesh cookie cutter, but unfortunately 12d was too smart for that and ignored it when reading into the drainage trimeshes! His team can, however, adjust their road strings to suit a drainage object with a bunch of fiddly MTF modifiers, tucking these away inside snippets to avoid alarming those poor engineers and BIM designers. It is even possible to create a null string containing the TIN boundary attribute to automatically cut a hole in any TIN the boundary is actually included in.

Enter your details to view the full presentation here.

12d Model Macros

Aidan Bickhoff – then a Civil Designer with Sunshine Coast Regional Council – speaks of his 2016 work designing a macro in 12d Model software to assist with the Local Government Infrastructure Plan (LGIP), in line with the Sustainable Planning Act (SPA 2009). Customisation using macros is a great way to get the most out of a comprehensive software package like 12d Model.

This undertaking was spurred on by a need to quickly develop multiple intersection concept design options and analyse the practicality and efficiency of these conceptual designs. Aidan’s role at Sunshine Coast Regional Council was to prepare designs for inclusion in the LGIP. The scope of the LGIP for which Aidan’s team was responsible was approximately $270 million between 2016-2031. The team was often called upon to prepare multiple design options – sometimes 15 or more – and multiple iterations of each option were required for each potential project with the LGIP to be submitted to the state government for approval. As the only Civil Designer in the team, it was a very time-consuming process to design all these options, and equally time-consuming for other members of the team to analyse and model the intersections.

It was clear that they were going to be unable to deliver the LGIP for submission to the state government without applying more resources (which wasn’t an option) or missing their deadline (again not an option).

They needed a more efficient design and analysis process…and so, from the fire and flames that is a raging Civil Designer’s desk, the SIDRA-2-12D Bridge was born one Saturday afternoon…and even in its early development phase, the team was able to get some proof-of-concept projects with a few basic intersection components/forms exported from 12d Model into SIDRA, and back again!

The current workflow and method of designing a static concept intersection within AutoCAD was very slow, and it couldn’t be dynamically updated post-optimisations from SIDRA. Furthermore, it was a cumbersome process and required manual translation of design data and variables from paper plans (AutoCAD output) into SIDRA…and vice-versa.

Old Workflow:

o Prepare concept design / intersection layout in AutoCAD

o Plot design as scaled drawing

o Create a new SIDRA Project

o Manually determine the intersection form (T-Intersection, Signals, Roundabout etc.)

o Scale & measure intersection details (Number of lanes, lane lengths, lane width etc.)

o Run SIDRA Analysis

o Optimise the design and re-analysis within SIDRA

o Print or PDF Intersection diagram from SIDRA

o Modify design in AutoCAD

After Aidan’s creation of the 12d Model Macro, ‘SIDRA-2-12D Bridge’, and a few customised intersection components, the team was able to seamlessly transfer the design properties of a Roundabout and Signalised Intersection to SIDRA for analysis, and then import the SIDRA output and re-run a design chain to update the intersection component.

New Workflow:

o Prepare concept design in 12d Model using a Customised Component

o Use the SIDRA-2-12D Bridge to create and pre-populate a SIDRA intersection project

o Run SIDRA Analysis

o Optimise the design and re-analysis within SIDRA

o Import the optimised design into 12D using the SIDRA-2-12D Bridge

o Run chain command to update component

o Reward yourself with some coffee and a donut, because you can actually finish at 5pm today!

Along with the two 12d Macros, one to Import and the other to Export the intersection component data, there were also a few other support files to liaise with the SIDRA .dll libraries and talk to the SIDRA database. From my proof-of-concept tests, Aidan was able to do over a week’s worth of work and refinement of designs in a few hours! Once the macros and translation files were further fine-tuned and matured, even more time savings began, both from a designer perspective and a traffic engineering/analysis perspective.

Where previously the design, analysis and optimisation process took days (often more than a week at a time), by combining the power and flexibility of 12d Components with SIDRA, this can now be done in 4-5 hours!

Figure 1: Export the component properties from 12d to SIDRA


Figure 2: Import optimised design from SIDRA and populate the component and re-run the chain in 12d

12d Model and Revit

Sean Lawrence of GHD Pty Ltd addressed our 12d Technical Forum delegates in July about his team’s use of 12d Model and Revit. Sean stated that using 12d Model with Industry Foundation Classes (IFCs) and Revit is quite advantageous for all Revit users; using this information allows them to have greater collaboration between the two products.

Previously, in other projects, the challenges they faced involved linking 12d Model drainage network models into Revit (various methods used include 3D CAD, ExDS .xml Generator, an Excel-based generator), 12d TINs into Revit (limited information) and Civil data into Revit (various plugins including Dynamo to try and replicate civil design data such as track slabs for light rail). However, across a major project, replicating 12d data in Dynamo without a dedicated resource can be a lengthy process. These methods often involved long and complicated import processes, and they only had limited information.

Using 12d Model with IFC helped to alleviate some of this. IFCs are the global standard used to describe, share, and exchange construction and facilities management information. As a data format, IFC is neutral and non-proprietary (i.e. not the product of, or favouring, any particular vendor).

GHD’s workflow for using 12d Model with Revit entails exporting an IFC file from 12d Model, editing the IFC file in a text editor, then linking it into Revit. They use the IFC Express Writer within 12d Model to facilitate this process. Once they’ve shifted the 12d Model closer to zero for Revit, they open it with a text editor so as to change the IFCCartesianPoint to 0,0 (the IFCCartesianPoint is the coordinate used by Revit as its placement point). This process will stop the data from being distorted and therefore useable by Revit.  This model shift and step of editing the file is not done for other software like Navisworks.

When exporting from 12d Model to Revit, Sean said it’s important to remember to change the IFCCARTESIANPOINT to ((0.0,0.0,0.0)), making sure the origin in the IFC Express Writer Dialogue Box matches the Revit Project base point coordinates, and to ensure the Export Attributes box has been ticked.

Before they bring it into Revit, they set up a few options that allow them to map certain 12d Model elements and IFC classes to an appropriate object inside Revit. They achieve this by setting up a template with a pre-defined project base point which allows them to generate a model in real-world coordinates. They also set an IFC mapping class, which allows them to map 12d elements to the correct Revit categories e.g. pipes that come out on an IFC element assembly to the Pipes category inside Revit, 12d TINs to a Site category inside Revit, and for anything that’s on a building element proxy, they can choose to map this to a generic model or something else.

Linking an IFC file into Revit creates a few extra automatic files (IFC files, Revit files, HTML Log files, and Shared Parameters files, which are used for mapping attribute data from 12d Model a parameter inside Revit). Sean demonstrated aspects of these processes, including handy tips for how to get around some issues that can arise, and how interrogating a model in Revit allows them to see all the different kinds of data that are coming through from attributes in 12d Model. Mapping attributes and checking calculations are correct is essential to this process.

So what is actually generated when we put an IFC into Revit from 12d Model? All the element information comes from the 12d Attributes, but it’s a static model when linking into Revit. By using these programs together, Sean’s team was able to produce an accurate replication of geometry without having to re-model through Dynamo. The colours were driven from 12d Model polygon colour mapping, which was ideal for standardisation. They used a Shaded/Realistic model with Graphics Display Options – Show Edges = “Off” to make polygon triangulation disappear (something Sean was able to demonstrate to the audience in his presentation), and created Linked Views for project consistency.

The string information from 12d Model, according to Sean, was extremely beneficial as an export – they were able to use IFC generated strings for 3D pick line modelling, and to colour strings by filter or category using the parameter information from 12d Model. Strings were used to show edges in 3D views while “Show Edges” was unticked.

In Plan View, some important steps in GHD’s processes included filtering 12d strings to show Control Lines and Road Linemarking, using filters to hide the lower Trimesh models for a cleaner view, and adjusting transparency to view below the surface. They also used shading techniques to get their Linked View plans looking consistent across all projects. In Section View, they filtered for annotation of different elements.

When linking 12d IFCs into Revit, there are automatically generated schedules for each IFC Class mapped, and schedules are generated as a result of the IFC Class to Revit Category Mapping Template. This allows them to check data and use it for their own techniques when writing documentation.

As with the trimeshes from 12d Model, the GHD team is able to use the IFCSite Export function from 12d to generate a Site category family of any TIN. The ability to export an existing SurveyTIN and SuperTin with Linework for use in drawings have also proved invaluable, as having cross-sectional display control, Plan Shaded, Colour Change, contour and linework control, and the ability to change Mapping of Survey export from ‘Generic Models’ to ‘Lines’ Revit category.

Sean also ran through some of the challenges his team faced in using Revit, such as not being able to edit elements when linking IFC files, and not being able to use colour overrides in Plan or 3D, and how upgrading to 12d Model 14 is helping them to overcome some of these issues. In particular, using IFC 4 in 12d Model 14, the team was able to bring data back into 12d. This method keeps file sizes smaller, allowing for more complex design. ‘Splitting data into Entity models’ allowed them to separate all the IFC elements into their individual IFC Class models.

The GHD team was also impressed by their ability to use these processes in their civil documentation without the need to remodel services – it all came directly out in their annotated cross sections, with the help of macros in 12d Model.

Overall, the positive impact of being able to use 12d Model in this way, Sean said, has given GHD the ability to gain accurate and up-to-date information in a variety of areas, to help them produce even better-detailed design jobs for their clients.

View the full video here.

Kerb Return and Cul-de-sac Design

Lisa Stewart caught up with Matt Stephens of 12d Victoria recently, for a very popular Training Webinar about ‘Kerb Return and Cul-de-sac Design’. In this information-packed session, attendees learnt how to create basic kerb returns and cul-de-sacs by using the Kret Convert to Computators command within 12d Model. Matt demonstrated two methods for creating a kerb return using a super alignment, then showed how to incorporate kerb returns into a design, including discussions on the Apply MTF Manager, Snippets, and Chains. He also showed two methods of producing cul-de-sacs in 12d Model, including discussion of road widening envelopes.

In addition, we went through some first principles with super alignments (including converting to IPs or Elements), to see what these tools do for the designer so they can be modified to cater for more complex cases.

The Technical Preview Version of 12d Model 14 is already in use by many of our customers on Maintenance who attended this year’s 12d Technical Forum…stay tuned for details of our 2020 event if you want to get in the loop early for 12d Model 15 as these lucky folks have done this time around!

Click here for training in your region.

Downhill Strings in 12d Model (including new V14 features)

In our recent Training Webinar entitled ‘Downhill Strings (including new V14 features)’, Owen Thornton of 12d Queensland discussed the Downhill Strings option in 12d Model, used for processing Super strings with z-values. The option has been significantly updated for 12d Model 14, and these changes were highlighted as part of a complete demonstration of the option.

In addition, for drainage designers, the interrelationship with the Utility String Editor was discussed, to modify the properties of the overland flow strings created by Downhill Strings.

NEW in 12d Model 14
Downhill Strings has a new look!

  • Now with standard source-boxes.
  • Manually drawn strings (across roads, culvert connections, etc) now only need to be drawn once. They can be specified as Extra Input to be processed and joined (but not downhilled).
  • Vertex data set by Utility String Editor on previous downhill strings, can be saved and re-applied to the new downhill strings.
  • Much less work to do when designs change and new downhill strings are required.

Owen also talked us through the four new tabs in the Downhill Strings panel.

 Downhill Strings also has:

  • A new toolbar icon on the new Water
  • A new location on the new and improved Water

The Technical Preview Version of 12d Model 14 is already in use by many of our customers on Maintenance who attended this year’s 12d Technical Forum…stay tuned for details of our 2020 event if you want to get in the loop early for 12d Model 15 as these lucky folks have done this time around!

Click here for training in your region: TRAINING DETAILS