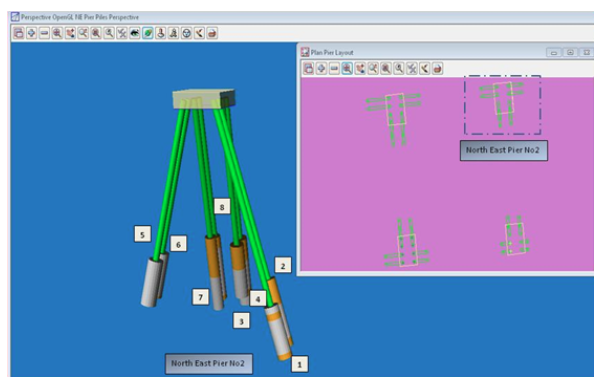
The existing Ferrymead Bridge was to be widened to accommodate additional traffic lanes as well cycle and pedestrian facilities. The design engineer and construction contractor found the analysis of geo-technical data was quite difficult, particularly in bridge columns that were raked at pre-determined angles and determining lengths. The ground information was also greatly varied. Combined, it was difficult to develop a clear picture of how the existing geotechnical conditions interacted with the bridge columns. The solution was to create 3D images of the columns and superimpose the ground data using 12d Model’s pipe strings. Geotechnical data was entered into 12d Model and TINs created for each stratum reflecting known geotechnical data and bore hole investigation results. 12d Model pipe strings were then modelled at the predetermined raked angle until they intersected the rock strata TIN. The pipe strings were modelled slightly larger than the design columns to clearly indicate the formation levels that were logged from the geotechnical reports. Using 12d Model’s pipe strings as columns enabled the accurate recreation of actual conditions and allowed 3D images to be created. “…(it was a) nice progression from site info to engineering scribble to practical masterpiece” Lloyd Greenfield Structural Engineer The structural engineer and construction contractor were able to clearly visualise geotechnical formations from data provided by geotechnical engineers.
Looking to build your utility modelling and design skills in 12d Model 15? The Self-Paced: Utility Modelling and Design – 12d Model 15 course provides practical, flexible online training designed to help you develop your skills at your own pace.
With 9 hours and 02 minutes of on-demand video training across 35 lessons, you’ll learn essential 12d Model utility modelling and design workflows through structured demonstrations, practical exercises, and engaging quizzes.
What You’ll Learn
This self-paced course will help you:
Build a strong foundation in utility modelling and design.
Learn practical workflows in 12d Model 15.
Develop and manage utility models.
Apply utility design techniques to real-world projects.
Reinforce your knowledge through practical quizzes.
Revisit training content whenever you need a refresher.
What’s Included?
For just $150, your enrolment includes:
9 hours 02 minutes of online video training.
35 self-paced lessons.
A 12d Model 15 software licence for three months.
Practical quizzes.
Certificate of Completion.
Ongoing access to 12d Model training content.
Access to 12d Model 15 Fundamentals, Getting Started for Utility Modelling, and Utility Design courses.
Learn at Your Own Pace
Self-paced online training gives you the flexibility to learn around your schedule. Pause, practise, revisit lessons, and build your confidence without the pressure of a one-off training session.
For the best learning experience, dual monitors are recommended so you can watch the lessons on one screen while completing the course work on the other.
Recommended Prerequisite
Completion of the Civil Design Basics course is recommended before starting. This provides the foundation needed to get the most from the utility modelling and design training.
Start Learning 12d Model Utility Design
Whether you’re developing new skills or refreshing your existing knowledge, this course provides a practical pathway to becoming more confident with utility modelling in 12d Model 15.
Enrol in the complete course for only $150 and start building your utility modelling and design skills today.
The 12d Tech Forum 2024 Directors Cut webinar, 12d Model and Google Earth, explored how 12d Model users can export civil engineering and surveying data into the Google Earth environment. Presented by Rodney Burns of Extra Dimension Solutions, the webinar highlighted enhanced tools available in 12d Model 15 that make it easier to communicate technical project information to non-technical audiences. By exporting project data while retaining important metadata, designers, surveyors and engineers can provide clients with a more accessible way to explore and understand project elements within a familiar 3D environment.
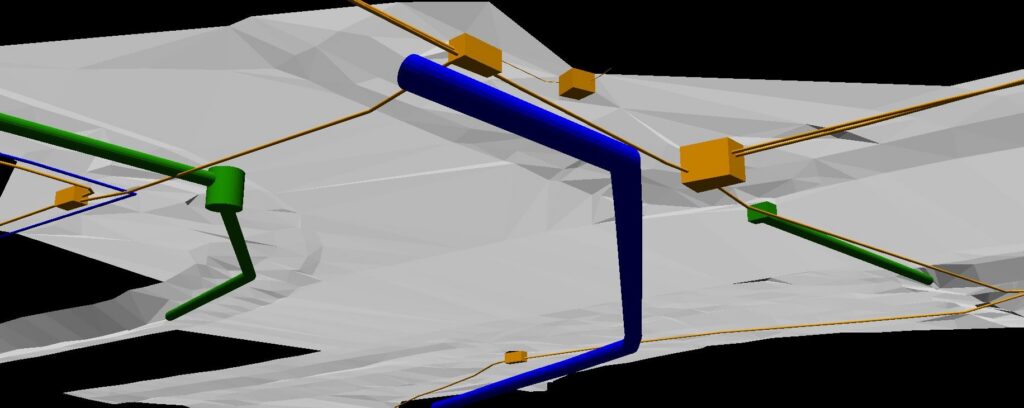
One of the key features demonstrated was the ability to export a wide range of project data, including contours, estate lots, drainage networks, survey marks, utilities and road designs. Users can control how data is positioned relative to Google Earth terrain, with options such as absolute elevation, relative elevation and clamping data to the ground. Additional settings allow users to control colours, labels, plot scale and text presentation. For example, drainage catchments and networks can be displayed directly on the terrain, while roof catchments can be positioned above the ground to create a more realistic representation. Drainage networks can also be exported as 3D trims, allowing pipe and pit information, along with associated attributes, to be viewed in three dimensions.
The webinar also demonstrated how 12d Model 15 can export alignment information, long sections and cross sections into Google Earth. Using the new Google Earth section plot functionality, users can apply existing plot parameter files and generate section plots that are stored with the relevant alignment or section data. These plots can then be viewed directly within Google Earth, giving clients an intuitive way to explore road designs and move between sections. This capability provides an alternative way of presenting design information without requiring clients to work directly within 12d Model, while still allowing technical information and design details to be communicated visually.
Overall, the enhanced Google Earth export capabilities in 12d Model 15 provide a practical way to bridge the gap between technical design data and client communication. By combining civil and surveying information with an interactive geographic environment, users can create visualisations that are easier for clients and other stakeholders to understand. The webinar demonstrated how these tools can support a variety of workflows, from presenting survey and utility information to visualising drainage, road designs and detailed cross sections, offering 12d Model users new ways to present and share their project data.
Unlock the power of point cloud data and learn how to turn millions of points into practical, manageable data in 12d Model 15.
Point clouds are becoming an increasingly valuable source of survey and spatial information, but working with large datasets can seem challenging without the right workflow. In this self-paced SPOT course, you’ll be introduced to the fundamentals of working with point clouds in 12d Model and learn practical techniques for importing, displaying, managing, reducing, and editing point cloud data.
Starting with the basics, you’ll learn how to import LAS point cloud files and configure important settings to improve display and performance. You’ll also explore point cloud classifications, allowing you to identify and isolate features such as ground, buildings, and vegetation.
As you progress through the course, you’ll discover how to reduce large datasets using point cloud mesh thinning. This powerful workflow allows you to transform millions of points into a more manageable dataset that can be converted into super strings, edited, and used to create a TIN surface.
You’ll also learn how to identify unwanted points, remove spikes and anomalies, and recalculate your TIN to create a cleaner and more usable ground surface.
Whether you’re new to point clouds or looking to build confidence using them in 12d Model, this course provides a practical introduction to the essential tools and workflows you need to get started.
What You’ll Learn
Throughout this course, you’ll learn how to:
Import LAS point cloud data into 12d Model 15.
Configure point cloud display settings for improved performance.
Use OpenGL views and graphics settings to get the most out of your hardware.
Pin point clouds and use levels of display to work more efficiently with large datasets.
Adjust point size and cloud display settings for clearer visualisation.
Understand and work with LAS point classifications.
Isolate categories such as ground, buildings, and vegetation.
Inspect point cloud information and understand the size of your dataset.
Use Point Cloud Mesh Thinning to significantly reduce the number of points.
Convert thinned point cloud data into manageable super strings.
Create a TIN surface from point cloud data.
Use contours and elevation information to identify spikes and unwanted features.
Edit and delete unwanted points using selection tools.
Recalculate and refine a TIN surface as your data is cleaned.
Apply practical tips and settings to improve your overall point cloud workflow.
Who Is This Course For?
This course is ideal for surveyors, civil designers, engineers, and 12d Model users who want to develop a foundational understanding of working with point cloud data.
No advanced point cloud experience is required. The course focuses on practical workflows and introduces the essential tools needed to confidently bring point cloud data into 12d Model and turn it into useful project information.
Build Your Point Cloud Skills
Large point cloud datasets don’t have to slow down your workflow. By understanding how to efficiently import, classify, thin, edit, and convert your data into a usable surface, you can spend less time managing millions of points and more time focusing on your project.
Start building your confidence with point cloud data and discover practical workflows that can help you work smarter in 12d Model 15.
Subtera (https://subtera.com.au/) supported Main Roads Western Australia on the Bakers Hill Road project by using 12d Model to deliver accurate subsurface utility data, helping improve design accuracy, identify potential clashes, and plan asset relocations and costs with greater confidence.
The task was to map all the subsurface utilities in Bakers Hill, WA – not a small undertaking! Main Roads WA needed this accurate information on the subsurface utilities in Bakers Hill WA to complete their design of a new road, in various formats, including from 12d Model.
Civil designers need their designs to work in the real world, and existing underground infrastructure can cause major issues. The existing records for the asset owners can be accessed through Dial Before You Dig (DBYD), but the spatial accuracy of these records is often not precise enough – in general there is a lot more underground than these records indicate, and the designers need data they can trust…enter subsurface utility locaters.
Dale Shearsmith’s team proceeded to locate all known Quality D utilities via Ground Penetrating Radar (GPR) and electromagnetic locaters. They then potholed for Quality Level A data.
SUI AS5488 (Classification of Subsurface Utility Information)
This Standard was prepared by Standards Australia Committee IT-036. The objective of this Standard is to provide utility owners, operators and locators with a framework for the consistent classification of information concerning subsurface utilities.
This Standard is intended to be used by those agencies and organisations that own, operate or regulate subsurface utility infrastructure and those that collect, depict and map such infrastructure. This Standard is also intended to be used by developers and consent authorities involved in the planning, approval and installation of subsurface utility infrastructure.
Subtera Methodology
To provide consistent data across projects, Subtera uses the following methodology
Take Quality Level C & D data and validate it to Quality Level A & B
Collate “As Constructed” drawings of the subsurface infrastructure
Ensure these utilities are located and surveyed
Search for “Unknown” subsurface utilities at the final stage
Every “Known” and “Unknown” utility will be accounted for in our field report providing an audit trail
We adhere to all asset owners regulations when accessing manholes and infrastructure and hold accreditions for ATCO High Pressure Gas, Telstra Fibre and the Watercorp
All works are carried out with a focus on Zero Harm to our employees and the public as outlined in our HSSE documentation
By delivering data to the AS5488 standard, the team was able to qualify the data with attributes, which flow through the design process, allowing Main Roads to accurately budget for asset relocations as well as trust the clash detections listed and integrate some of the utilities that were already there, allowing for more saving of money.
The Civil and Surveying Institute, the largest and most experienced provider of authorised 12d Model training courses, offers a range of training courses in different formats. This course is designed to be accessible to all 12d Model users. For the best learning experience, familiarity with the MTF is highly recommended, as the standard components are based on native MTF commands. While it is not required, completing the Civil Design Basics course beforehand will also give you a solid foundation and help you get the most out of the training.
Enrol in the entire course for only $250(AUD) excl GST
This Self-Paced Online Training course includes 3 hours 40 minutes of on-demand video training, allowing you to learn at your own pace with structured guidance.
As a part of the course, trainees access:
• 12d Model 15 licence for 3 months
• 23 tailored video lessons
• Full lifetime access to the 12d Model training content
• Practical and engaging quizzes
• Certificate of Completion
This course introduces the power of Snippets in 12d Model through the graphical user interface in the Snippet Components panel, showing how they can make design work faster, more flexible, and more efficient than traditional methods. You’ll learn how the MTF Snippet Apply, Snippet Manager, and Snippet Components work together to quickly create snippets and multiple Apply MTF Functions using reference strings, MTF seed files, and snippet parameters. The course also takes you through building a complete road snippet from scratch, combining familiar MTF commands with custom components to create road surfaces, table drains, batter benching, pavement layers, and other design elements directly from a cross-section.
You’ll also develop practical skills for managing more advanced snippet requirements, including the use of Parameters, Tokens, and Link Variables, customised chainages, conditional logic, and complex sub-layers. The course covers automatic parameters for retrieving project attributes and publishing custom attributes to support BIM compliance, as well as techniques for managing layer conflicts. To help you work confidently with and troubleshoot snippets, you’ll also learn how to encrypt and protect your snippets, structure workspaces effectively, interpret parsing logs, and use MTF flattening to identify and resolve errors.
This project for the Queensland Government in Queensland, Australia, was delivered with Connell Wagner (now Aurecon) as the consultant and John Martin as the contractor.
In the words of (then) Queensland Premier Peter Beattie, the development of a new integrated community – Brisbane’s Kelvin Grove Urban Village – is “a vision for the future.” Connell Wagner has been an integral part of this vision.
Much of the Village is situated on the former Gona Barracks site and surrounding areas. The Gona Barracks site was originally owned by the Department of Defence (DoD), while the remaining area was jointly owned by Queensland University of Technology (QUT) and the Queensland Government, Department of Housing (DoH).
The DoH and QUT are now redeveloping the entire site as a mixed-use and residential precinct, incorporating retail, commercial, and university functions and accommodation, including projects such as QUT’s Creative Industries. The project is the first of its type and is designed to help integrate the university back into the community, supporting QUT’s philosophy of “A university for the real world.”
The construction of the Village was designed to minimise environmental impact while preserving important cultural aspects of the site. As Principal Consultant for the infrastructure delivery, Connell Wagner also faced a number of design challenges, including heritage areas such as trees, buildings, and open spaces on the upper parade ground that had to be preserved.
During the early planning phase, the project team consulted with both the Turrbal Association and the Heritage Council, resulting in a Cultural Heritage Management Plan. The project aimed to create “a vibrant, new urban environment that meets the lifestyle needs of the community, but does not compromise the environment for future generations”¹, in keeping with the principles and practices of Ecological Sustainable Development (ESD).
Designer John Martin said, “The original site was extremely undulating with extensive existing infrastructure and contaminated material on the site, which had to be remediated by either removal or controlled burial on site.”
“One aim of the project was to make the streets as friendly as possible for disabled access, bicycles, etc – all the sorts of things you find in a new urban environment and at a university. The grading of the roads and the blocks has been critical in terms of the outcomes that were required for the project.”
The project involved significant rework and numerous design options. According to Mr Martin, “The fact that we were able to turn around the options extremely quickly with 12d Model, often ‘on the fly’, was great. I’d sit at the computer with the landscape architect, the engineer on the job, the council planning officers, and the client, and shift things around on the screen so they’d be able to immediately see what was going on. It was simple!”
“Because of the nature of the site, we were repeatedly calculating cuts and fills. We also built a park, one of several, through the site, now called Kulgun Park. Going just from looking at plans and long-sections and such, it’s quite hard to visualise what was happening. The fact that we were able to produce a quick perspective of what the finished site was actually going to look like was extremely beneficial. Without 12d Model, we would have had a lot of trouble putting together something to show the layperson how the finished product would look at completion.”
According to Principal Project Engineer Mark Reardon, “One issue (of many) that the project had to resolve was the integration of the new stormwater system into the existing stormwater network. Because of the staging of the project, we had to plan progressive links between the new and the old systems. Being able to hold all that information in the model was a great advantage. We serviced all the other design teams that were on the job with long-sections, cross-sections, and contours and were able to do this very quickly.”
“Another issue was remediation. The identified contaminated areas were logged, and we then created a number of different layers to show where the contaminated areas were in both plan and sectional view. We used these sectional views to display what was going to happen in the future and how deep under the finished surface the contaminated material would be.
“We had to prove this to the Department of Defence as part of a sales agreement. Additionally, we had to show where residential areas, in particular the building footprints, would be in relation to remediated areas to settle an argument they had in terms of getting the site removed from the Environment Protection Agency’s EMR (Environmental Management Register). 12d Model was invaluable for this.”
“Brisbane City Council was also very happy with our procedure of using 12d Model to demonstrate the finished surface. In fact, that was one of the reasons we got the approval. Their two major concerns were predicting the appearance of the finished product and ensuring public safety in the future. Because we could get down on a visual plane and give relative heights, we could illustrate these aspects with confidence and alleviate concerns.”
“Overall, everyone was pleased with the project outcome. It’s currently being constructed and we’re almost out of the ground now.”
The project was scheduled for completion in August 2003, with QUT’s Creative Industries Project due to open its doors for students at the start of the 2004 academic year.
¹ Quotation from The Urban Village brochure pack by the Queensland Government Department of Housing and Queensland University of Technology.
Manual entry of traverse data into the Least Squares Dialogue can be time-consuming and, when calculations are involved, can introduce the risk of human error. To address this challenge, Queensland Rail (QR) developed a utility to streamline the process by automatically extracting observations from a field file and generating the required Horizontal and Vertical Least Squares input files.
The utility also helps keep field files clean and manageable by reformatting attribute data, assigning the correct data identifiers, and removing unpopulated attributes. By automating these tasks, the workflow reduces manual effort and screen clutter while improving efficiency and consistency throughout the survey processing process.
The team at Queensland Rail (QR) had the idea to develop a tool that would create input files to be read by the horizontal and vertical least squares dialogues in 12d Model software. The program would read a field file and extract all the observations to the control points and write the data out to the *.in and *.lin text files. This would save a lot of time compared to manual entry, and remove human error. The files could be read into the Least Squares dialogues and processed.
The manual input of traverse data into the Least Squares Dialogue in 12d Model can be prone to user error when manual calculations are involved. As a response, QR set out to develop a utility that creates a Horizontal Least Squares Input and Vertical Least Squares Input files from the field file. The Horizontal Least Squares Input file was to have the extension YourFileName.in. The Vertical Least Squares Input file was to have the extension YourFileName.lin. The files were to be saved to the same location as YourFileName.fld.
The attribute reformat was written at the same time that the 12d Attribute Macro was developed. At that time, the Macro only removed the white space 73 lines, not the unpopulated attribute. Hence the functionality was included in this tool.
To enable the proper use of the attributes attached to a given observation code, the attribute had to be given its correct attribute type. The line identifier in the field file is used to determine the data type and therefore the way 12d Model can handle the attribute. With the QR Code library set up for generic use, the reality is that the majority of feature codes will not have a populated attribute attached to an observation code in every instance.
The created tool reads the field file and interrogates each code attribute and reassigns the correct data identifier to the attribute and deletes any unpopulated attributes.
This utility reformats the field file attribute data and removes all unpopulated attributes with the goal of only displaying useful information instead of empty descriptors in the project.
The tool developed reads a field file and extracts all the observations to the control points and writes the data out to the *.in and *.lin text files. The files are read into the least squares dialogs and processed. The control model created is then used in the field file reduction to control the processed observations. Screen clutter is reduced, and efficiency increased—saving time and money.
Piritahi is a large scale construction alliance in Auckland, New Zealand, delivering the civil engineering and infrastructure needed to support thousands of new state homes. Working for Kāinga Ora, Piritahi is undertaking one of New Zealand’s largest urban regeneration programmes, a five year, approximately NZ$1 billion programme spanning around 52 square kilometres across six established Auckland neighbourhoods. The project involves replacing ageing infrastructure and enabling the redevelopment of thousands of state homes, all while working within complex brownfield environments and around existing homes, services, roads and residents.
With a project of this scale, effective collaboration and data management are essential. 12d Model and 12d Synergy have played a key role in helping Piritahi manage the volume and complexity of its design, survey and construction information. 12d Model has been used across multiple disciplines to develop 3D designs for roads, stormwater and sewer networks, existing services and intersections, while also integrating with GIS platforms, Revit, XP SWMM, 3D scanning and drone survey data. 12d Synergy provides a central platform for around 500 users across the alliance, enabling teams to securely access, manage and collaborate on project information from anywhere. Its cloud-based setup became particularly valuable during COVID 19 lockdowns, allowing teams to continue working remotely while maintaining a single source of truth and a clear audit trail.
Together, these digital tools have helped Piritahi create a more connected and efficient approach to design, construction and data management. From 3D modelling and clash detection to GIS visualisation, augmented reality and construction survey data, information can be shared between teams and fed back into the design process. By using technology to support collaboration throughout the project lifecycle, Piritahi is not only helping to deliver complex infrastructure more efficiently but also contributing to a broader goal: creating safe, warm and dry homes for communities across Auckland.
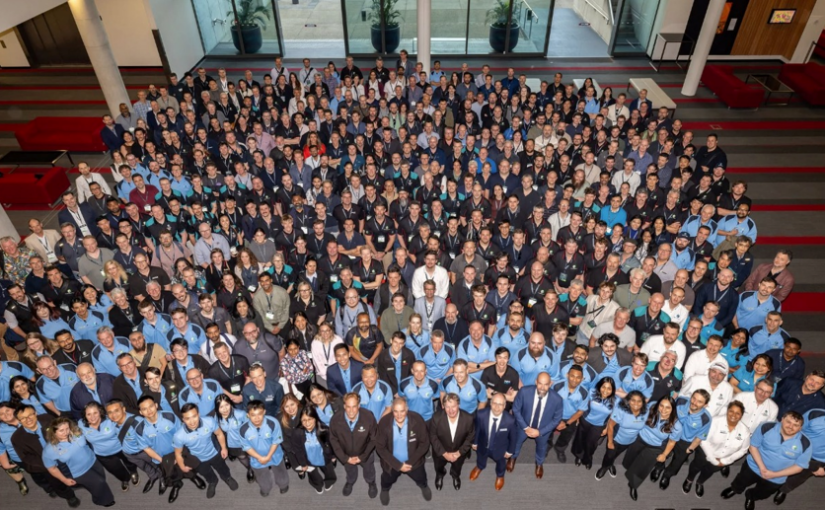
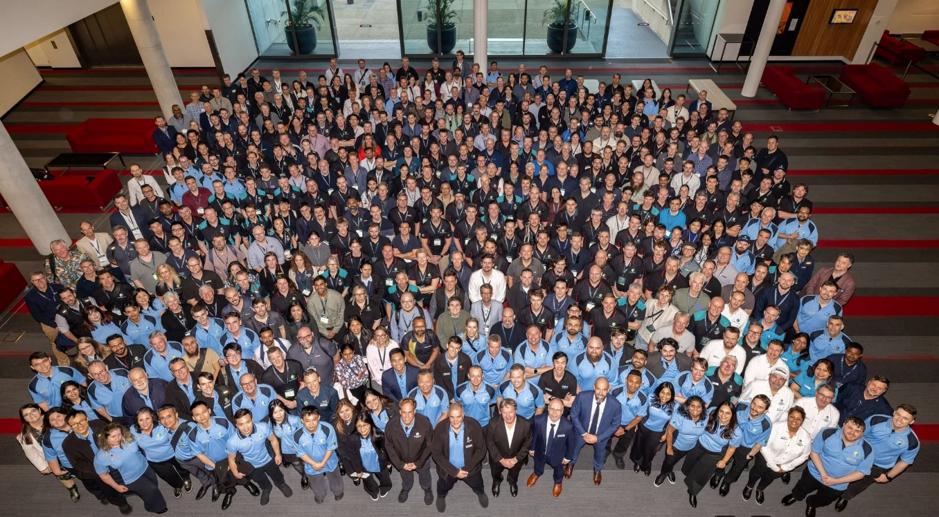
Thank you to everyone who was part of the 12d Tech Forum 2026 – the energy, the connections, and the shared passion for the industry made this an event to remember, and our most successful yet (with 700+ attendees over the three days, we had our hands and hearts well and truly full!).
Thank you especially to our Sponsors: WW Surveys (Gold), C.R. Kennedy (Coffee Cart), Stantec (Gala Dinner), ESO Surveyors (Silver), 4D Prisma (Silver), Civillo (Silver), NetCare (Bronze), Propeller (Bronze), Digital Enginuiti (Bronze), Surveyors Australia (Bronze), CHCNAV (Bronze), and 1Spatial (Bronze).
We’d also like to take a moment to appreciate our valued exhibitors, who added extra excitement to the event: C.R. Kennedy, 4D Prisma, SITECH | UPG, Aptella, ManGoesMapping, CHCNAV, Hi-Target, Abtrac, Civillo, Surveyors Australia, Propeller, 1Spatial, Mach9, NetCare, Digital Enginuiti, Stantec, and ESO Surveyors. It was wonderful to have such a vibrant exhibition space, bigger than ever before.
We had all the Main Stage sessions recorded, and – as you might expect – that’s added up to quite a bit of footage! We’re working through it now to determine the best way to share it with you, and Main Stage videos will start rolling out on the SPOT platform in the coming weeks.
And yes, we’re already planning the 12d Tech Forum 2028…stay tuned for dates!