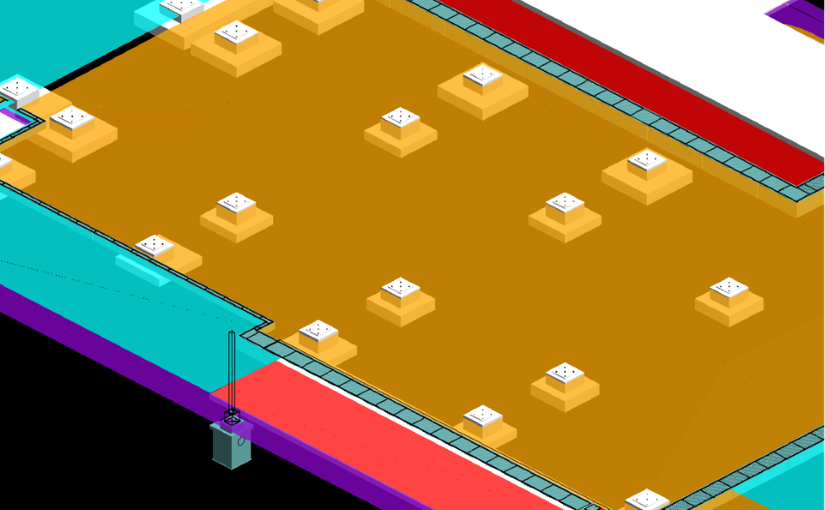
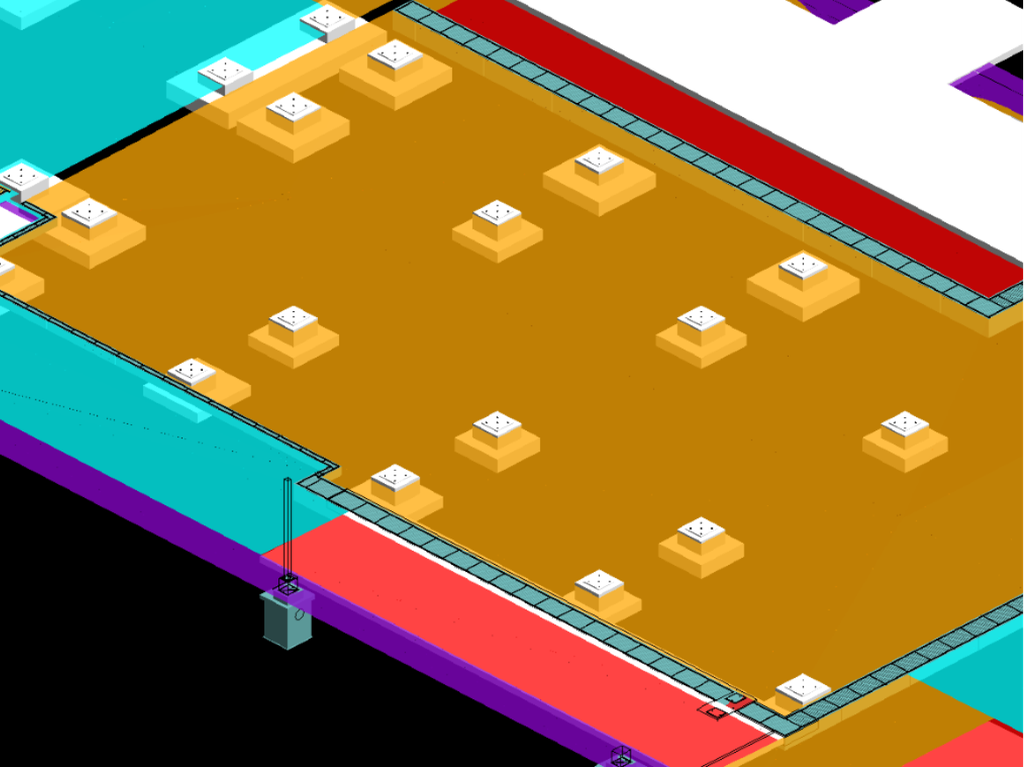
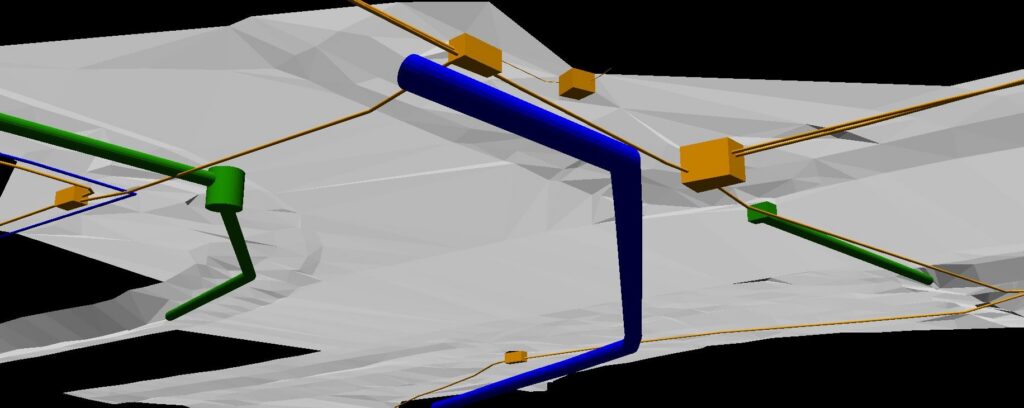
In a gas plant project, 12d Model was used to design civil engineering components for integration into PDMS (Plant Design Management System), supporting multidisciplinary design coordination.
However, PDMS did not natively support certain civil engineering elements, including road designs and TIN surfaces. Transferring civil design data required additional CAD preparation and manual editing, making updates time-consuming and increasing the potential for errors.
To address this, a custom macro was developed to automate the transfer of civil engineering elements from 12d Model to PDMS. Using configurable mapping files, the workflow could be adapted for different PDMS projects, reducing manual intervention and streamlining design updates.
The resulting workflow enabled more efficient transfer of civil design surfaces, allowing other disciplines to access updated information for design coordination and clash checking. It also preserved the flexibility of 12d Model for civil design modifications while reducing reliance on manual CAD editing.
This project demonstrates how 12d Model’s customisation and automation capabilities can improve data exchange and support multidisciplinary coordination in complex plant design environments.
Calibre Rail, now part of WSP (https://www.wsp.com/en-au), played a key role in the Rowley Yard expansion for Fortescue Metals Group in Port Hedland, Western Australia, using 12d Model to tackle complex rail, earthworks and drainage challenges while supporting a cost-effective solution that saved more than AUD $2 million in capital costs.
Fortescue Metals Group (FMG) undertook a $US8.4bn expansion program to triple the size of its operations and take it to 155 million tonnes of iron ore per annum by mid 2013. FMG had a triplication of their rolling stock fleet. To meet the demand and the growth in associated maintenance procedures, an expansion of their existing facilities at Rowley Yard, Port Hedland was required.
FMG expansion plans ceased during the global financial crisis. As a result, the study and execution of their ambitious plans ground to a halt. Calibre Rail’s role as EPCM contractor was to take these preliminary studies and upgrade the mainline, which started in late 2010. With construction commencing on the other elements of the mainline (such as the triplication of the load-out loop, a new fuel facility and duplication of the mainline), there was little time to investigate the issues associated with Rowley Yard. A few of the issues faced include: – Earthworks modelling of both sub-grade and capping layer – Drainage issues and tying into the existing network – Service clashes – Development of a staged approach to the construction of the yard to minimise disruption.
20 options were investigated using the powerful ‘element method’ tools within 12d Model’s Super Alignment, with the turnout placement function providing a quick and effective method to arrange track layouts. Storm water drainage design was developed in 12d Model. Three options were investigated, limiting pipe sizes to 900, 1200 & 1500(mm). A cost/benefit analysis was completed that compared pit and pipe quantities and thrust boring sites. With the site 1600km away from the nearest pipe supplier, this decision was critical to logistics planning. “Using 12d to design this solution saved more than $AUD2million in capital costs for the project.” The storm water drainage design was independently verified. Diversion drains were mapped in 12d Model using the HEC RAS writer. Importing the water surfaces from HEC RAS to 12d Model was used to then calculate tail water conditions.
“12d modelling isn’t just a click of a button. It often takes many attempts to find a solution to a problem. In a brown field environment, where little planning had been done in the past…issues were constantly faced. “It seemed that everything we touched was broken and every solution we tried to implement failed. This led to blowouts in the delivery, but we are very happy with the result thanks to 12d Model and its vast array of tools.” —Chris Compton, Fortescue Metals Group
When the deadline is the Olympic Games, there is little room for redesign, delay or coordination issues.
When London was selected to host the 2012 Olympic Games, the city had to deliver large-scale venues and infrastructure capable of supporting approximately 24,000 athletes. The Olympic Village site presented an additional challenge: it was located within an already developed urban environment, constrained by surrounding infrastructure including a high-speed rail link, while also requiring new roads, earthworks and utilities to support the Games.
For Arup, the scale and complexity of the project called for a different approach to civil design. Stakeholder feedback meant that design options would continue to evolve, while contractors were already working to demanding construction programmes. Changes therefore needed to be assessed quickly and translated into construction documentation without disrupting the wider design.
Arup implemented 12d Model to bring the civil design together in a single, connected model. Earthworks, roads and utilities were modelled within 12d Model, allowing designers working on different elements to reference shared design information and coordinate their work.
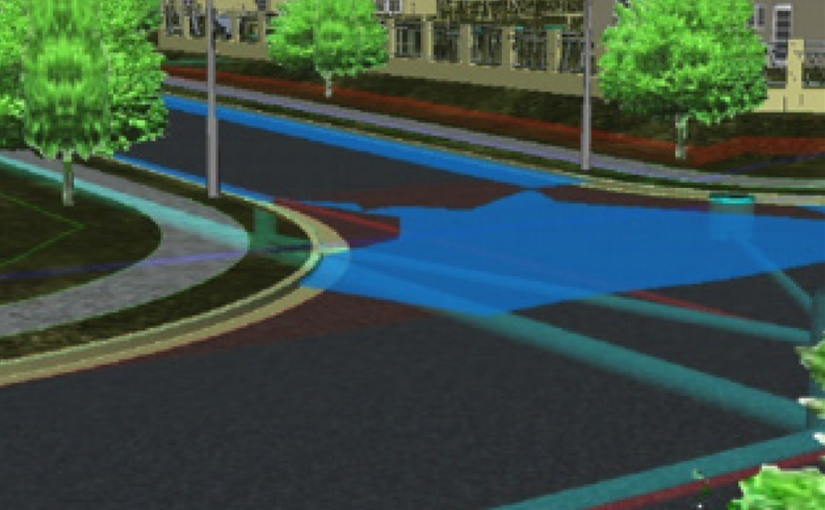
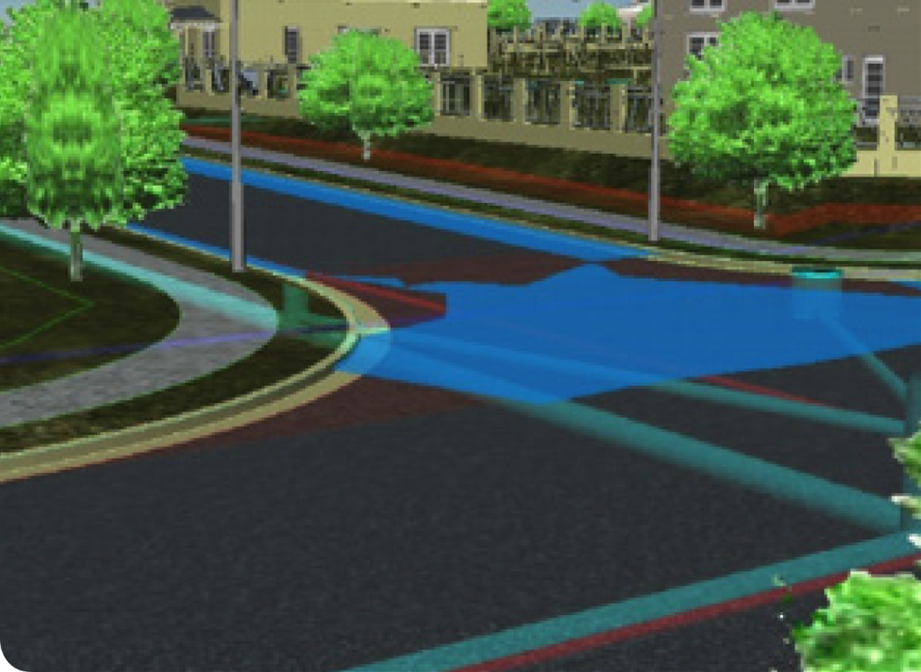
This was particularly valuable for the site’s extensive subsurface utilities. By modelling the utilities alongside the other civil elements, the team could identify potential clashes during design rather than discovering them during construction. As the design developed, 12d Model’s automated recalculation capabilities also allowed options and changes to be tested quickly, making it easier to assess their impact across the wider site.
The complete 3D model provided another important advantage. Arup and the client could review the civil design from all angles before documentation and construction, helping them assess how roads, earthworks and underground services would work together within the constrained site.
Once the design was confirmed, the model could be used to produce the documentation required by construction contractors. Automated processes and reusable standard components helped reduce manual work and accelerate the design cycle, supporting the project’s demanding programme.
The result was a more connected design process that allowed Arup to develop, coordinate, review and document the civil works within a single model, helping keep pace with one of the world’s most time-critical infrastructure projects.
As the project team noted:
“The modelling of all subsurface utilities in 12d Model was the ultimate design solution to prevent problems during the construction phase.”
The London 2012 Olympic Village is a strong example of how integrated civil modelling can help engineering teams manage complex sites, respond to changing requirements and make critical design decisions before they reach construction.
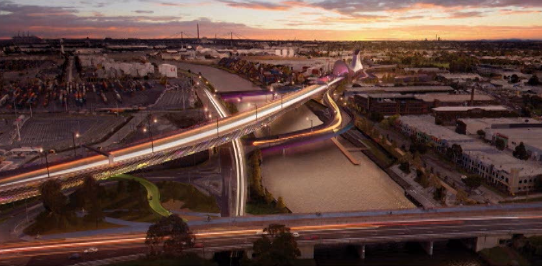
Aurecon Jacobs JV played a key role in the West Gate Tunnel Project ( in Victoria, working alongside CPB and John Holland to tackle the complexities of one of Melbourne’s major infrastructure projects, with 12d Model supporting accurate, coordinated civil design and project delivery.
The West Gate Tunnel Project is broken up into 3 sections – the West Gate Freeway (out west), the Tunnels (in the middle), and the Port to City (in the east).
The Freeway section involves upgrading from eight lanes to twelve, including an express lane between the M80 Ring Road and the West Gate, and 4 interchange upgrades.
The summary on the West Gate Tunnel website lists:
Extra lanes on the freeway between the M80 Ring Road and Williamstown Road
Entry and exit portals where the tunnels connect with the West Gate Freeway
Ventilation structure at the tunnel exit to remove air from inside the outbound tunnel
Interchange upgrades at the M80 Ring Road, Millers Road, Grieve Parade and Williamstown Road
Ramps to Hyde Street to connect trucks directly with local industry
Noise walls to reduce traffic noise for residents and open spaces
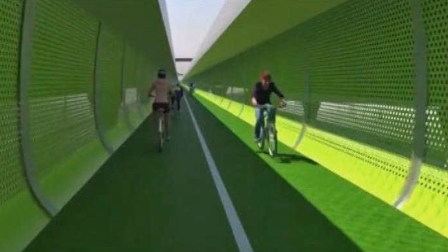
Walking and cycling paths to complete missing links in the Federation and Kororoit Creek trails and better connect communities, including new overpasses over Williamstown Road and Stony Creek
Pedestrian bridges replacing the existing overpasses
Freeway Management System to support good traffic flow and safety
New open spaces and planting thousands of trees and other plants in the freeway area.
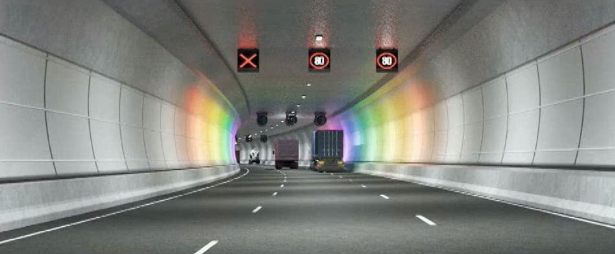
The Tunnels component includes two three-lane tunnels, one inbound tunnel of 2.5km and one outbound tunnel of 3km – all to take motorists and trucks off residential streets.
The website also lists:
Twin tunnels under Yarraville between the West Gate Freeway and the Maribyrnong River
Entry and exit portals where the tunnels connect with surface roads
Ventilation structures at each tunnel exit to remove air from inside the tunnels
Walking and cycling paths on Hyde Street, Harris Street, Maribyrnong Street and a bridge over Whitehall Street
New landscaped open space in Altona North and Footscray
Freeway Management System to support good traffic flow and safety
Tunnel safety features for smooth operation of the tunnel, including automatic detection for over-height trucks, fire systems and emergency access and exits.
The Port to City section involves a new bridge over the Maribyrnong River River to connect the tunnels, with an elevated roadway along Footscray Road connecting to CityLink, Dynon Road and Footscray Road, running above the centre of Footscray Road, as well as direct links to Port of Melbourne, CityLink and an extension and widening of Wurundjeri Way.
The website also lists:
Ramps to the port at MacKenzie Road and Appleton Dock Road for direct freeway acces
Walking and cycling paths for quicker and safer cycling to the city with a new veloway and bridges over Footscray Road and Moonee Ponds Creek
Extending Wurundjeri Way north to Dynon Road to create a city bypass
Freeway Management System to improve traffic flow and safety
New open spaces and planting thousands of trees and other plants in the freeway area.
Design Production – Workflows
12d Model and 12d Synergy are both in use on this project, along with various other packages.
12d Model was selected to do the long sections and cross sections across the entire job, as well as the modelling of the tunnel components and the bridges over the Maribyrnong River.
The team needed to develop efficient processes for bringing in data from other packages. They worked out the best workflows for them, with particular attention to consistency across the entire project.
With their incoming 2D CAD and 3D Models, the main advantage of 12d Model was that they could copy sections of the bridge and tunnel modules and make sure everything was aligned. The process they came up with was running a Chain for each 2D Drawing and each 3D Model that would create a project for each DWG, and then in that Chain they’d also create a date stamp model and use a 12d Synergy search to look for that date stamp model (and compare against a search in another package). From there, they’d work out what was out-of-date and re-run just that Chain.
The team copied DWG files to the 12d Synergy Server and gave them their own Chain, Project, and Mastershare labels – applying a naming convention. Dummy models were created at chain runtime (date analysis). Ongoing date modification analysis was performed using Excel Queries. 12d Synergy was their single source of truth.
Custom Reporting
The team needed a lot of custom reporting due to other software packages being used, with different types of reporting requirements. They learnt to be prepared on the BIM journey for ‘curly’ output requirements, and to ‘make friends with’ Excel and VBA.
They experimented with XSLT Files (12d Report Definition Files), and adapted to Legacy Workflows developed on previous jobs for MX (the hand they were dealt).
The next challenge was how to get data out of 12d Model so it could go into Dynamo and Revit to produce the tunnel rings – for this they enlisted Matt Monk to create a macro to report the perpendicular points between the centre of the tunnel and report it back to the control road which is not in the centre of the tunnel.
Chain Usage
Users were upskilled on how to use parameters in their chains – this happened on the job, with great success.
Custom Widgets were created, with Prompt Result Inputs – (yes, no, cancel). The ‘cancel’ widget was particularly useful in case something fell over halfway through running of the Chain.
Two of their favourite uses were:
Prompt Result Values > PVFs for filename concatenation
Using Widget button to pick result and GoTos they could loop within chains (also very nifty) – naming something differently each time it was used on any number of strings
They employed one Road Design Output PPF per Zone with multiple PVFs, leading to a huge process improvement to the speed of their output, which was noticed by users.
Snippet Usage
Road Barriers – used extensively – need penetration details on stormwater pits; option to change height of first string/extend barrier
Kerbs
Vehicle Clearance and Roll Allowance (AGRD and RTA values) – vehicle clearance was a parameter set by the project (going under bridges etc.) but the sway envelope allowed gathering of AustRoads figures – design speed, left and right crossfall, etc.
L-Shaped Retaining Walls – ability to insert after a string, etc. Means you can set wall thickness, vertical offset to top string, footing RL, footing thickness, leg length forward/back – quite dynamic and went together pretty well
Road Deck Slabs/multi-floor tunnel portals for space proofing – took existing 12d 2-point slab snippet and added ability to put crossfall, RL, etc. Insert a string higher up in MTF and be able to trace it. Pavement Wearing Course (for XSs)
Sign Legibility (Guide to Traffic Management: Traffic Control Devices) and Sight Line – input speed, sign dimensions, offset to control line, how many words on sign, type of vehicle, number of lanes, etc. -> draws a mesh with sign in distance and ability to profile string
ITS Trenches by Trench Type/make your own (experimental at this stage)
Also experimented with Sub-Soil Drains (how to attach to a pavement layer and such) and Trench
Structure items modelled in 12d Model as space proofing prior to modelling
Tunnel Mesh
Tunnel Portals
Basic Bridge Crossings
2D Road Design Exports
PVFs within Chains used extensively for exporting hundreds of DWGs
Naming Convention Control
Consistency
Repeatability
Quickly expandable
Temporary Entity duplication > String Info Change
Long section/cross section MESH colour control
Label style manipulation
Not good for point count with MESHES
3D Road Design Exports
General
Road TRIA, MESH and STRS > DWG and IFC > Navisworks
Road TRIA, MESH and STRS > SML > Contractor Setout
The Department of Transport and Main Roads, Queensland, undertook the preliminary design for approximately 12 kilometres of the Kennedy Highway in Queensland, Australia. The highway travels west from Cairns through Kuranda and on to Mareeba, connecting the coast with the tablelands. The project crosses the Macalister Range and passes through the Wet Tropics World Heritage Area, creating a challenging environment in which to develop and communicate the proposed upgrade.
A key part of the project was developing a realistic representation of both the existing environment and the proposed highway, allowing the design team to visualise the project before construction.
Building the Existing Environment
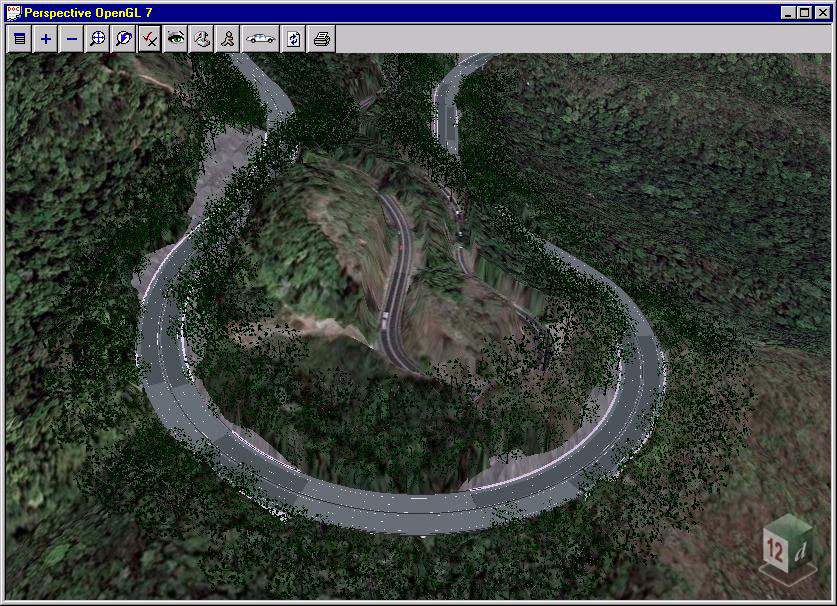
The existing terrain was constructed from airborne LiDAR data collected by helicopter, providing the foundation for modelling the project area. Aerial photography was then draped over the resulting triangulation to create a realistic representation of the existing landscape.
This provided a detailed terrain and visual context in which the proposed highway could be developed and assessed.
Developing the Highway Design in 12d Model
The concept design for the new highway was developed using 12d Model, incorporating not only the road design but also key infrastructure and environmental features.
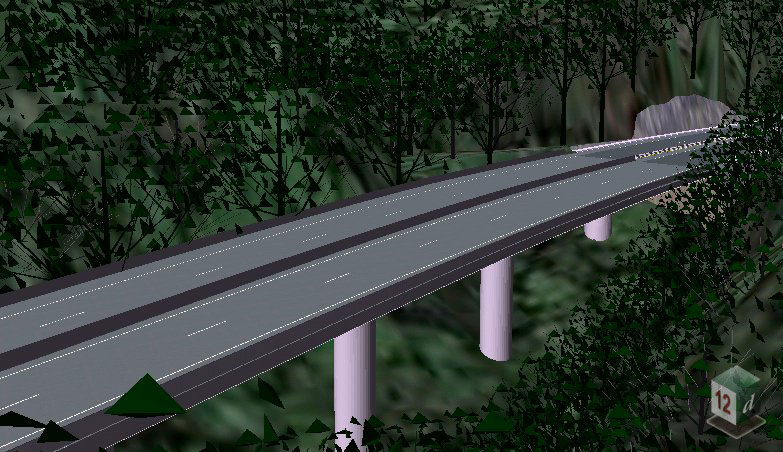
The first half of the project included 28 of the 34 bridges, which were modelled using super strings. Roadside barriers and vegetation were also modelled in 12d Model, creating a more complete representation of the proposed highway and its surroundings.
By bringing these elements together with the existing terrain and aerial imagery, the team could assess the proposed infrastructure within its wider landscape context.
Creating a Virtual Fly-Through
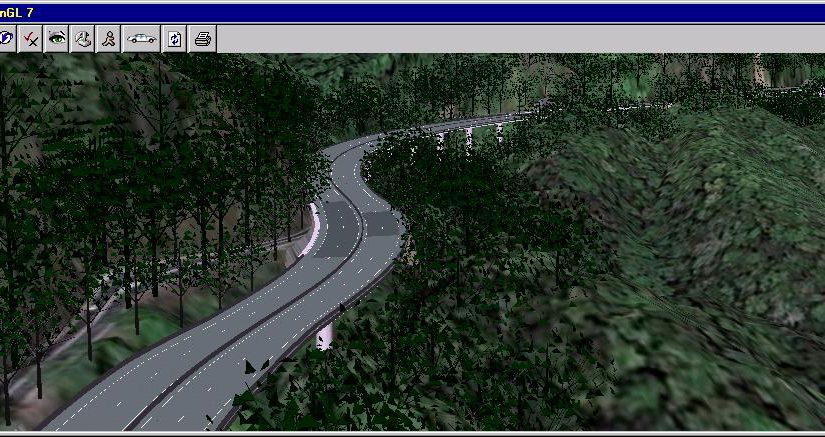
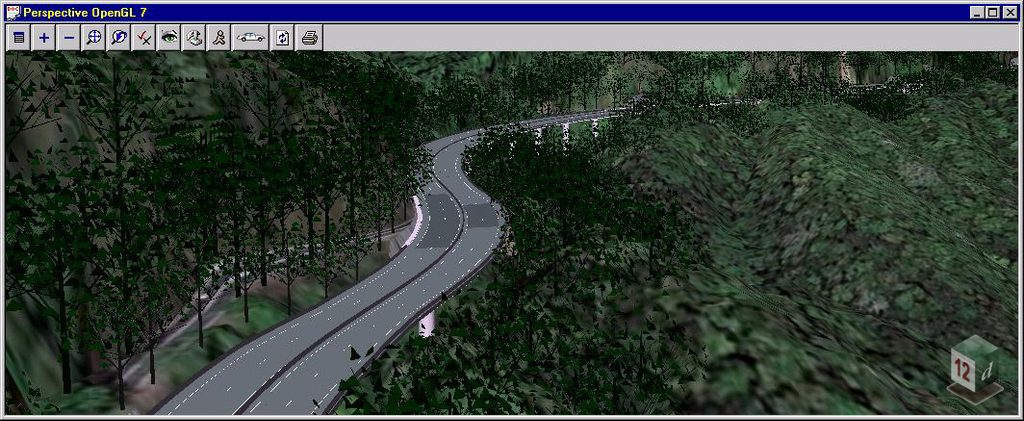
The project team used the 12d Model environment to create virtual fly-overs, drive-throughs and selected views of the proposed highway.
These visualisations provided an opportunity to view the proposed route from different perspectives and understand how the highway, bridges and other infrastructure would appear within the surrounding terrain. The drive-through for the final section of the highway was also subsequently completed with the aid of 12d Model.
Visualising the Project Before Construction
The completed model provided a realistic representation of how the upgraded highway and surrounding area could look following construction and regrowth.
Being able to virtually drive along and fly over the proposed highway before it was built gave the project team a practical way to communicate and review the preliminary design. It also helped provide a clearer understanding of how the proposed road and structures would integrate with the existing landscape.
The Kennedy Highway project demonstrates how 12d Model can combine survey data, terrain modelling, civil design and 3D visualisation to provide a more complete understanding of a proposed infrastructure project before construction begins.
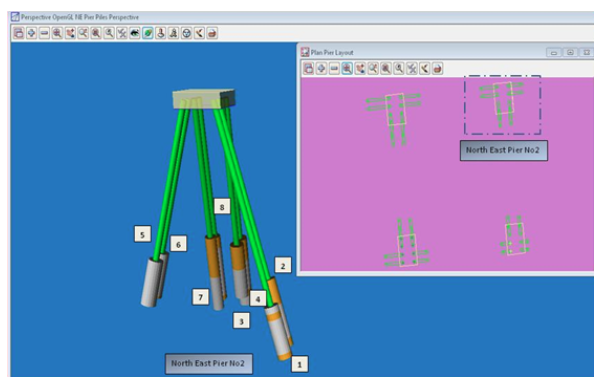
The existing Ferrymead Bridge was to be widened to accommodate additional traffic lanes as well cycle and pedestrian facilities. The design engineer and construction contractor found the analysis of geo-technical data was quite difficult, particularly in bridge columns that were raked at pre-determined angles and determining lengths. The ground information was also greatly varied. Combined, it was difficult to develop a clear picture of how the existing geotechnical conditions interacted with the bridge columns. The solution was to create 3D images of the columns and superimpose the ground data using 12d Model’s pipe strings. Geotechnical data was entered into 12d Model and TINs created for each stratum reflecting known geotechnical data and bore hole investigation results. 12d Model pipe strings were then modelled at the predetermined raked angle until they intersected the rock strata TIN. The pipe strings were modelled slightly larger than the design columns to clearly indicate the formation levels that were logged from the geotechnical reports. Using 12d Model’s pipe strings as columns enabled the accurate recreation of actual conditions and allowed 3D images to be created. “…(it was a) nice progression from site info to engineering scribble to practical masterpiece” Lloyd Greenfield Structural Engineer The structural engineer and construction contractor were able to clearly visualise geotechnical formations from data provided by geotechnical engineers.
Subtera (https://subtera.com.au/) supported Main Roads Western Australia on the Bakers Hill Road project by using 12d Model to deliver accurate subsurface utility data, helping improve design accuracy, identify potential clashes, and plan asset relocations and costs with greater confidence.
The task was to map all the subsurface utilities in Bakers Hill, WA – not a small undertaking! Main Roads WA needed this accurate information on the subsurface utilities in Bakers Hill WA to complete their design of a new road, in various formats, including from 12d Model.
Civil designers need their designs to work in the real world, and existing underground infrastructure can cause major issues. The existing records for the asset owners can be accessed through Dial Before You Dig (DBYD), but the spatial accuracy of these records is often not precise enough – in general there is a lot more underground than these records indicate, and the designers need data they can trust…enter subsurface utility locaters.
Dale Shearsmith’s team proceeded to locate all known Quality D utilities via Ground Penetrating Radar (GPR) and electromagnetic locaters. They then potholed for Quality Level A data.
SUI AS5488 (Classification of Subsurface Utility Information)
This Standard was prepared by Standards Australia Committee IT-036. The objective of this Standard is to provide utility owners, operators and locators with a framework for the consistent classification of information concerning subsurface utilities.
This Standard is intended to be used by those agencies and organisations that own, operate or regulate subsurface utility infrastructure and those that collect, depict and map such infrastructure. This Standard is also intended to be used by developers and consent authorities involved in the planning, approval and installation of subsurface utility infrastructure.
Subtera Methodology
To provide consistent data across projects, Subtera uses the following methodology
Take Quality Level C & D data and validate it to Quality Level A & B
Collate “As Constructed” drawings of the subsurface infrastructure
Ensure these utilities are located and surveyed
Search for “Unknown” subsurface utilities at the final stage
Every “Known” and “Unknown” utility will be accounted for in our field report providing an audit trail
We adhere to all asset owners regulations when accessing manholes and infrastructure and hold accreditions for ATCO High Pressure Gas, Telstra Fibre and the Watercorp
All works are carried out with a focus on Zero Harm to our employees and the public as outlined in our HSSE documentation
By delivering data to the AS5488 standard, the team was able to qualify the data with attributes, which flow through the design process, allowing Main Roads to accurately budget for asset relocations as well as trust the clash detections listed and integrate some of the utilities that were already there, allowing for more saving of money.
This project for the Queensland Government in Queensland, Australia, was delivered with Connell Wagner (now Aurecon) as the consultant and John Martin as the contractor.
In the words of (then) Queensland Premier Peter Beattie, the development of a new integrated community – Brisbane’s Kelvin Grove Urban Village – is “a vision for the future.” Connell Wagner has been an integral part of this vision.
Much of the Village is situated on the former Gona Barracks site and surrounding areas. The Gona Barracks site was originally owned by the Department of Defence (DoD), while the remaining area was jointly owned by Queensland University of Technology (QUT) and the Queensland Government, Department of Housing (DoH).
The DoH and QUT are now redeveloping the entire site as a mixed-use and residential precinct, incorporating retail, commercial, and university functions and accommodation, including projects such as QUT’s Creative Industries. The project is the first of its type and is designed to help integrate the university back into the community, supporting QUT’s philosophy of “A university for the real world.”
The construction of the Village was designed to minimise environmental impact while preserving important cultural aspects of the site. As Principal Consultant for the infrastructure delivery, Connell Wagner also faced a number of design challenges, including heritage areas such as trees, buildings, and open spaces on the upper parade ground that had to be preserved.
During the early planning phase, the project team consulted with both the Turrbal Association and the Heritage Council, resulting in a Cultural Heritage Management Plan. The project aimed to create “a vibrant, new urban environment that meets the lifestyle needs of the community, but does not compromise the environment for future generations”¹, in keeping with the principles and practices of Ecological Sustainable Development (ESD).
Designer John Martin said, “The original site was extremely undulating with extensive existing infrastructure and contaminated material on the site, which had to be remediated by either removal or controlled burial on site.”
“One aim of the project was to make the streets as friendly as possible for disabled access, bicycles, etc – all the sorts of things you find in a new urban environment and at a university. The grading of the roads and the blocks has been critical in terms of the outcomes that were required for the project.”
The project involved significant rework and numerous design options. According to Mr Martin, “The fact that we were able to turn around the options extremely quickly with 12d Model, often ‘on the fly’, was great. I’d sit at the computer with the landscape architect, the engineer on the job, the council planning officers, and the client, and shift things around on the screen so they’d be able to immediately see what was going on. It was simple!”
“Because of the nature of the site, we were repeatedly calculating cuts and fills. We also built a park, one of several, through the site, now called Kulgun Park. Going just from looking at plans and long-sections and such, it’s quite hard to visualise what was happening. The fact that we were able to produce a quick perspective of what the finished site was actually going to look like was extremely beneficial. Without 12d Model, we would have had a lot of trouble putting together something to show the layperson how the finished product would look at completion.”
According to Principal Project Engineer Mark Reardon, “One issue (of many) that the project had to resolve was the integration of the new stormwater system into the existing stormwater network. Because of the staging of the project, we had to plan progressive links between the new and the old systems. Being able to hold all that information in the model was a great advantage. We serviced all the other design teams that were on the job with long-sections, cross-sections, and contours and were able to do this very quickly.”
“Another issue was remediation. The identified contaminated areas were logged, and we then created a number of different layers to show where the contaminated areas were in both plan and sectional view. We used these sectional views to display what was going to happen in the future and how deep under the finished surface the contaminated material would be.
“We had to prove this to the Department of Defence as part of a sales agreement. Additionally, we had to show where residential areas, in particular the building footprints, would be in relation to remediated areas to settle an argument they had in terms of getting the site removed from the Environment Protection Agency’s EMR (Environmental Management Register). 12d Model was invaluable for this.”
“Brisbane City Council was also very happy with our procedure of using 12d Model to demonstrate the finished surface. In fact, that was one of the reasons we got the approval. Their two major concerns were predicting the appearance of the finished product and ensuring public safety in the future. Because we could get down on a visual plane and give relative heights, we could illustrate these aspects with confidence and alleviate concerns.”
“Overall, everyone was pleased with the project outcome. It’s currently being constructed and we’re almost out of the ground now.”
The project was scheduled for completion in August 2003, with QUT’s Creative Industries Project due to open its doors for students at the start of the 2004 academic year.
¹ Quotation from The Urban Village brochure pack by the Queensland Government Department of Housing and Queensland University of Technology.
Manual entry of traverse data into the Least Squares Dialogue can be time-consuming and, when calculations are involved, can introduce the risk of human error. To address this challenge, Queensland Rail (QR) developed a utility to streamline the process by automatically extracting observations from a field file and generating the required Horizontal and Vertical Least Squares input files.
The utility also helps keep field files clean and manageable by reformatting attribute data, assigning the correct data identifiers, and removing unpopulated attributes. By automating these tasks, the workflow reduces manual effort and screen clutter while improving efficiency and consistency throughout the survey processing process.
The team at Queensland Rail (QR) had the idea to develop a tool that would create input files to be read by the horizontal and vertical least squares dialogues in 12d Model software. The program would read a field file and extract all the observations to the control points and write the data out to the *.in and *.lin text files. This would save a lot of time compared to manual entry, and remove human error. The files could be read into the Least Squares dialogues and processed.
The manual input of traverse data into the Least Squares Dialogue in 12d Model can be prone to user error when manual calculations are involved. As a response, QR set out to develop a utility that creates a Horizontal Least Squares Input and Vertical Least Squares Input files from the field file. The Horizontal Least Squares Input file was to have the extension YourFileName.in. The Vertical Least Squares Input file was to have the extension YourFileName.lin. The files were to be saved to the same location as YourFileName.fld.
The attribute reformat was written at the same time that the 12d Attribute Macro was developed. At that time, the Macro only removed the white space 73 lines, not the unpopulated attribute. Hence the functionality was included in this tool.
To enable the proper use of the attributes attached to a given observation code, the attribute had to be given its correct attribute type. The line identifier in the field file is used to determine the data type and therefore the way 12d Model can handle the attribute. With the QR Code library set up for generic use, the reality is that the majority of feature codes will not have a populated attribute attached to an observation code in every instance.
The created tool reads the field file and interrogates each code attribute and reassigns the correct data identifier to the attribute and deletes any unpopulated attributes.
This utility reformats the field file attribute data and removes all unpopulated attributes with the goal of only displaying useful information instead of empty descriptors in the project.
The tool developed reads a field file and extracts all the observations to the control points and writes the data out to the *.in and *.lin text files. The files are read into the least squares dialogs and processed. The control model created is then used in the field file reduction to control the processed observations. Screen clutter is reduced, and efficiency increased—saving time and money.
As a key consultant involved in the Stronger Christchurch Infrastructure Rebuild Team (SCIRT), Eliot Sinclair (https://www.eliotsinclair.co.nz/contact) leveraged 12d Model to support the $2.5 billion Christchurch rebuild, contributing to the surveying, drainage, sewer, and road design required to restore critical infrastructure following the devastating 2010–2011 Canterbury earthquakes.
During the 2010 and 2011 earthquake sequence in Canterbury, a series of LiDAR (Light Detection and Ranging) surveys was commissioned to enable analysis with a pre -earthquake baseline LiDAR dataset collected in 2003. As a result of the ongoing seismic activity, five LiDAR surveys were carried out by the end of 2011. These surveys followed each major earthquake greater than magnitude 6.0.
The effective use of LiDAR datasets is dependent on an understanding of the inherent errors. Consideration of these possible errors when analysing datasets enables levels of confidence and limitations to be applied for specific uses. Preliminary comparisons by the client between the LiDAR datasets and the published levels of official control marks suggested that the supplied LiDAR dataset was outside its stated accuracy tolerance. Inherent problems arise when comparing the levels of control marks to LiDAR points, as the LiDAR points may not have been secured on the same ground surface as the control mark. Control marks are often buried under trees or vegetation and therefore not measureable by LiDAR. The number of official control marks available after earthquake events reduced from 3500 to just 30 marks.
Computer upgrades to 64-bit operating system and 32GB RAM were necessary to allow the import and processing of 2 billion points. 12d automated macros were developed to complement 12d Model’s TIN reporting functions to compare and report differences between LiDAR TINs and known topographical control points. The height difference between LiDAR and topographical points was presented on plan using height range files to represent and illustrate the variance in colour.
“We used 12d Model to not only achieve good results from the analysis, [which was] made possible by the existing reporting and macros we developed. We were able to impress the client in our ability to respond to their needs and provide a solution to a problem with unique timeframes and [a unique] audience…“Our results have been peer reviewed by an independent party and one dataset has also been re-tested (in another package). The results from the peer review indicated 12d Model was the right choice on the software package used to undertake this analysis and confirmed our results match those of the GIS software.” —Sam Cech, Eliot Sinclair and Partners